Overview
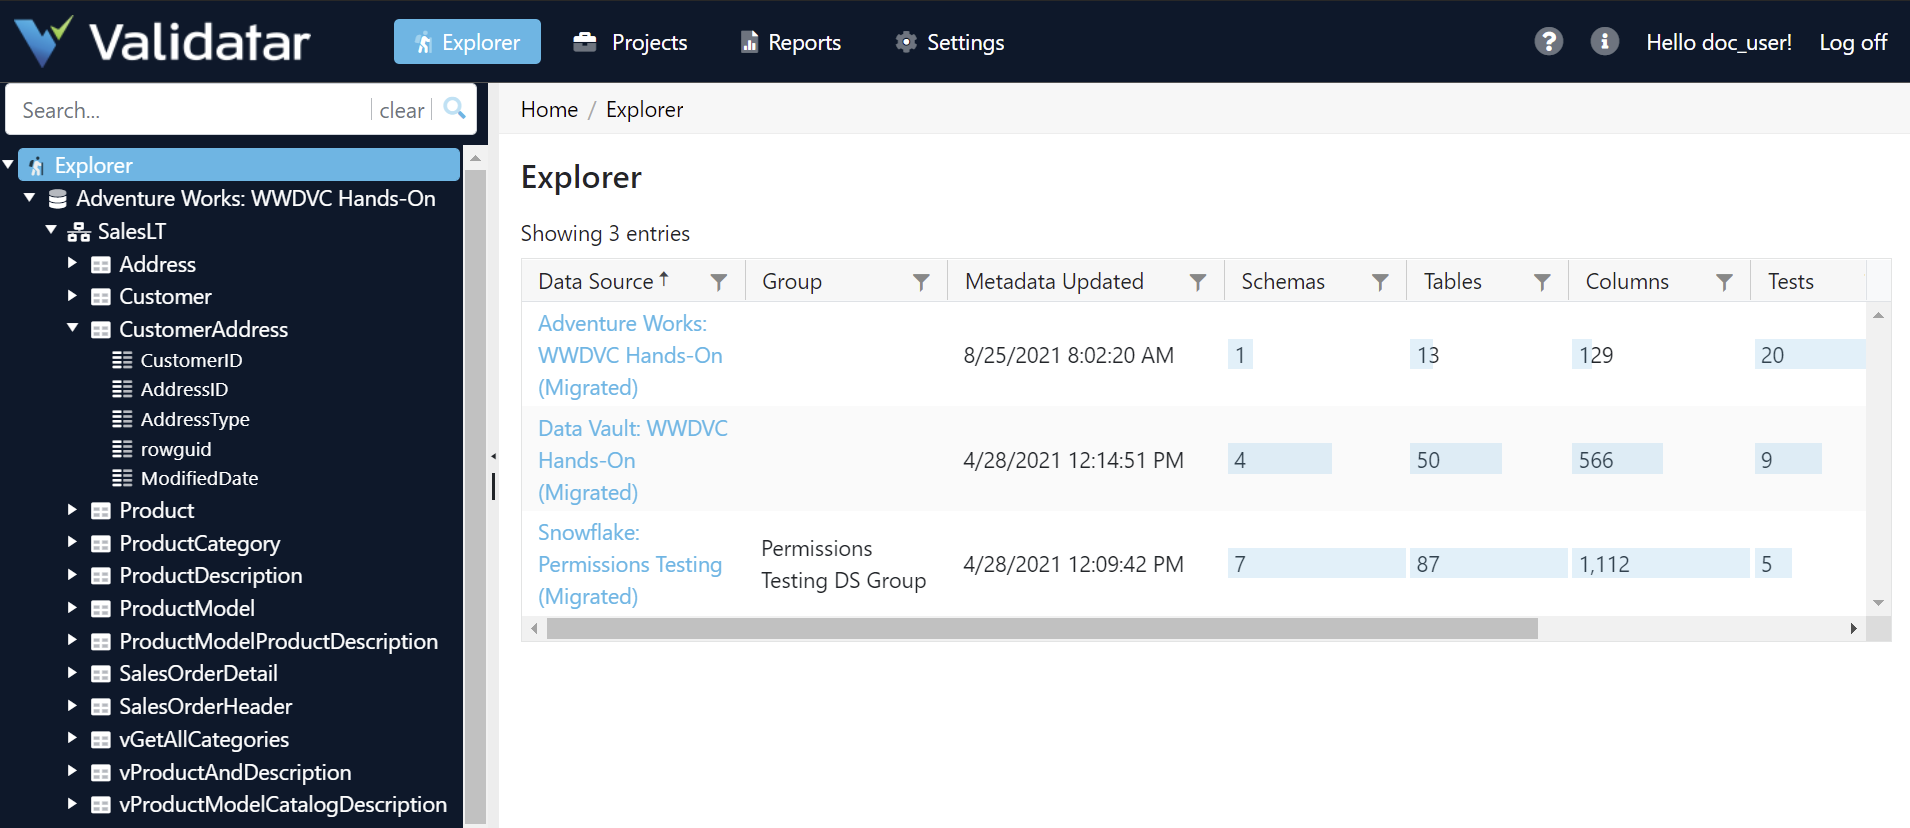
The Explorer area is where you can dive into the profile of each of your data sources making data discovery easy!
- You’ll be able to see an overview of your metadata as well as drill into column-level profiles.
- You can easily see test coverage and identify any gaps in testing.
- You can also search for objects of interest and see their data quality.
Displayed Information

What's in the Table?
| Column Name | Description |
|---|---|
| Data Source | The data source name. |
| Group | The data source group. |
| Metadata Updated | The date and time the metadata was last refreshed. |
| Schemas | The count of schemas in the data source |
| Tables | The count of tables and views in the data source. |
| Columns | The count of columns in a data source. |
| Tests | The number of tests that has a metadata link to that the data source. |
| % Tables with Tests | The coverage of tables in the data source that have a test associated with it. |
| % Columns with Tests | The coverage of coverage in the data source that have a test associated with it. |