Overview
Viewing the profile of your data source is simple! Once you’ve selected your data source you can drill down until you reach the level of detail you want.
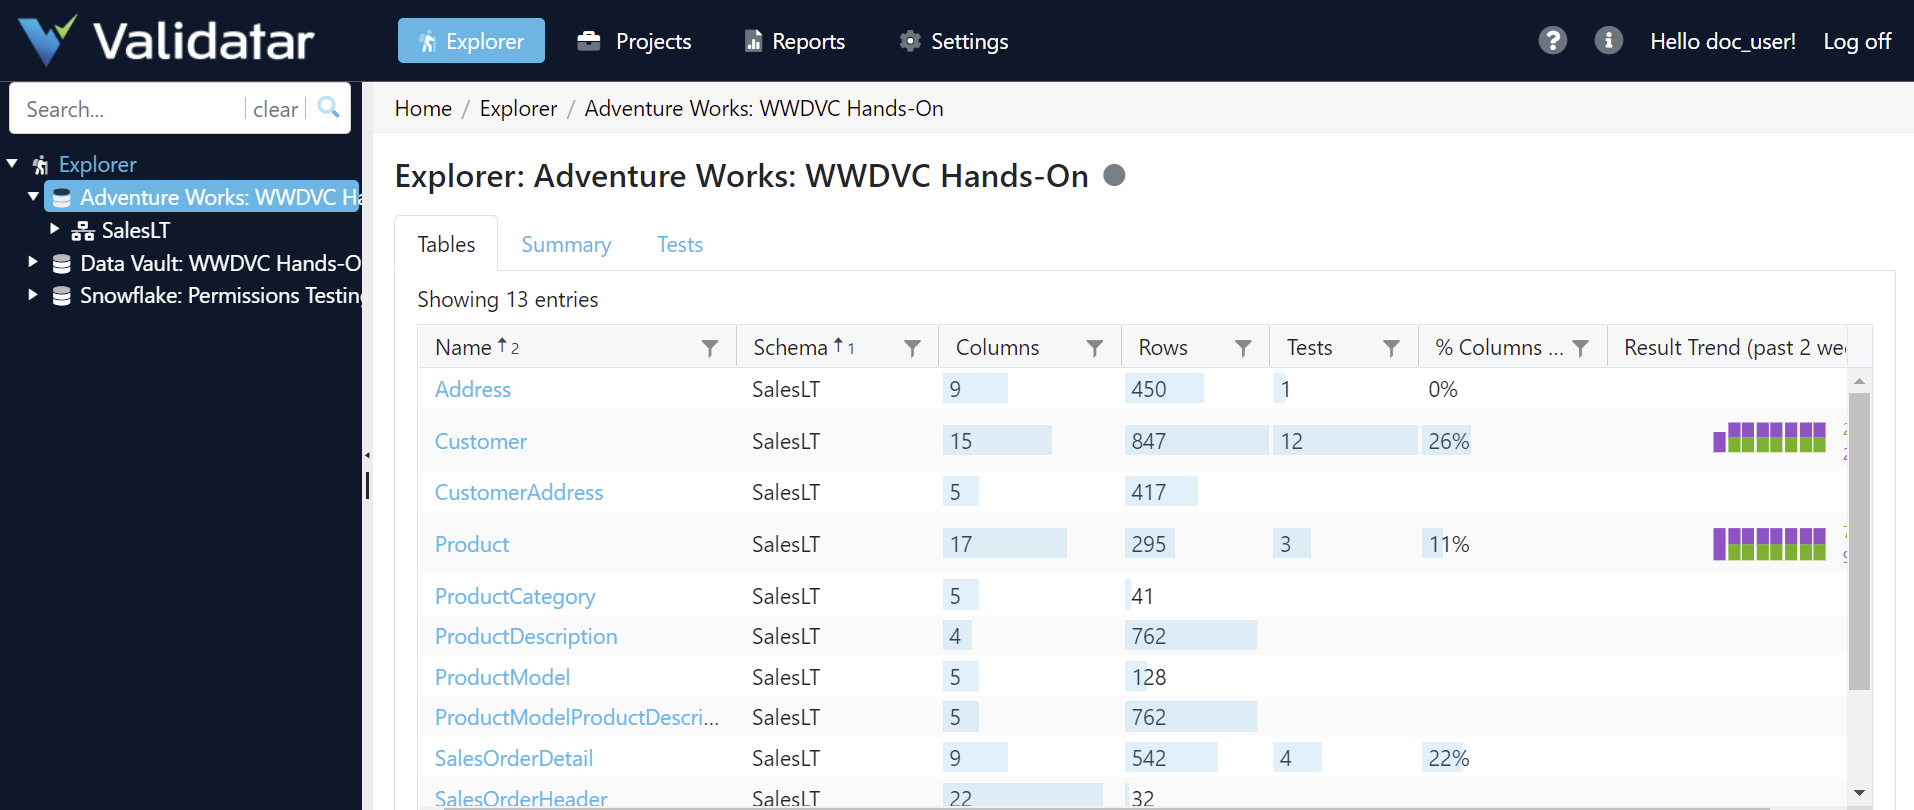
- Data Source level: An overview of the number of schemas, tables, and columns in your data source as well as a look into Validatar’s test coverage of the data source. The greater the test coverage, the more accurate and acceptable your data quality is.
- Table level: The table view shows a list of all of the tables and views in a data source as well as an overview of the metadata connected to each table. The Result Trend column shows how many tests linked to that table have passed, failed, or executed with an error within the past two weeks. Learn more about the Result Trend below.
- Column level: The column list shows all the same data as the table list. Click on the column name to view the full profile details.
Result Trend
The result trend column shows a graphical representation of how many tests related to a table or a column have passed, failed, or executed with an error in the past two weeks. Viewing the trend of results lets you know how consistent your data quality is. Hover over the graphic to view test results for each day.
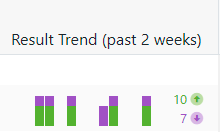
- Green bars represent passed tests. Purple bars represent failed tests. Orange bars represent tests executed with an error.
- A high deviation may indicate data that’s constantly changing or being updated.
- A low deviation may indicate data that’s consistent and has not been changed.
The result trend lets you know how consistent your data is but whether the result is passed or failed is another important aspect. As testing continues over time, you should see more passed test results. If you do not, it’s good to revisit your written test and check that any changes to your database or source system have been implemented. Consistently failed tests may indicate that necessary changes to either the database or data structure have not been implemented in a timely manner.
The result trend does not reflect test executions that have been run to the screen. All results are pulled from what has been saved to the test repository.
Summary
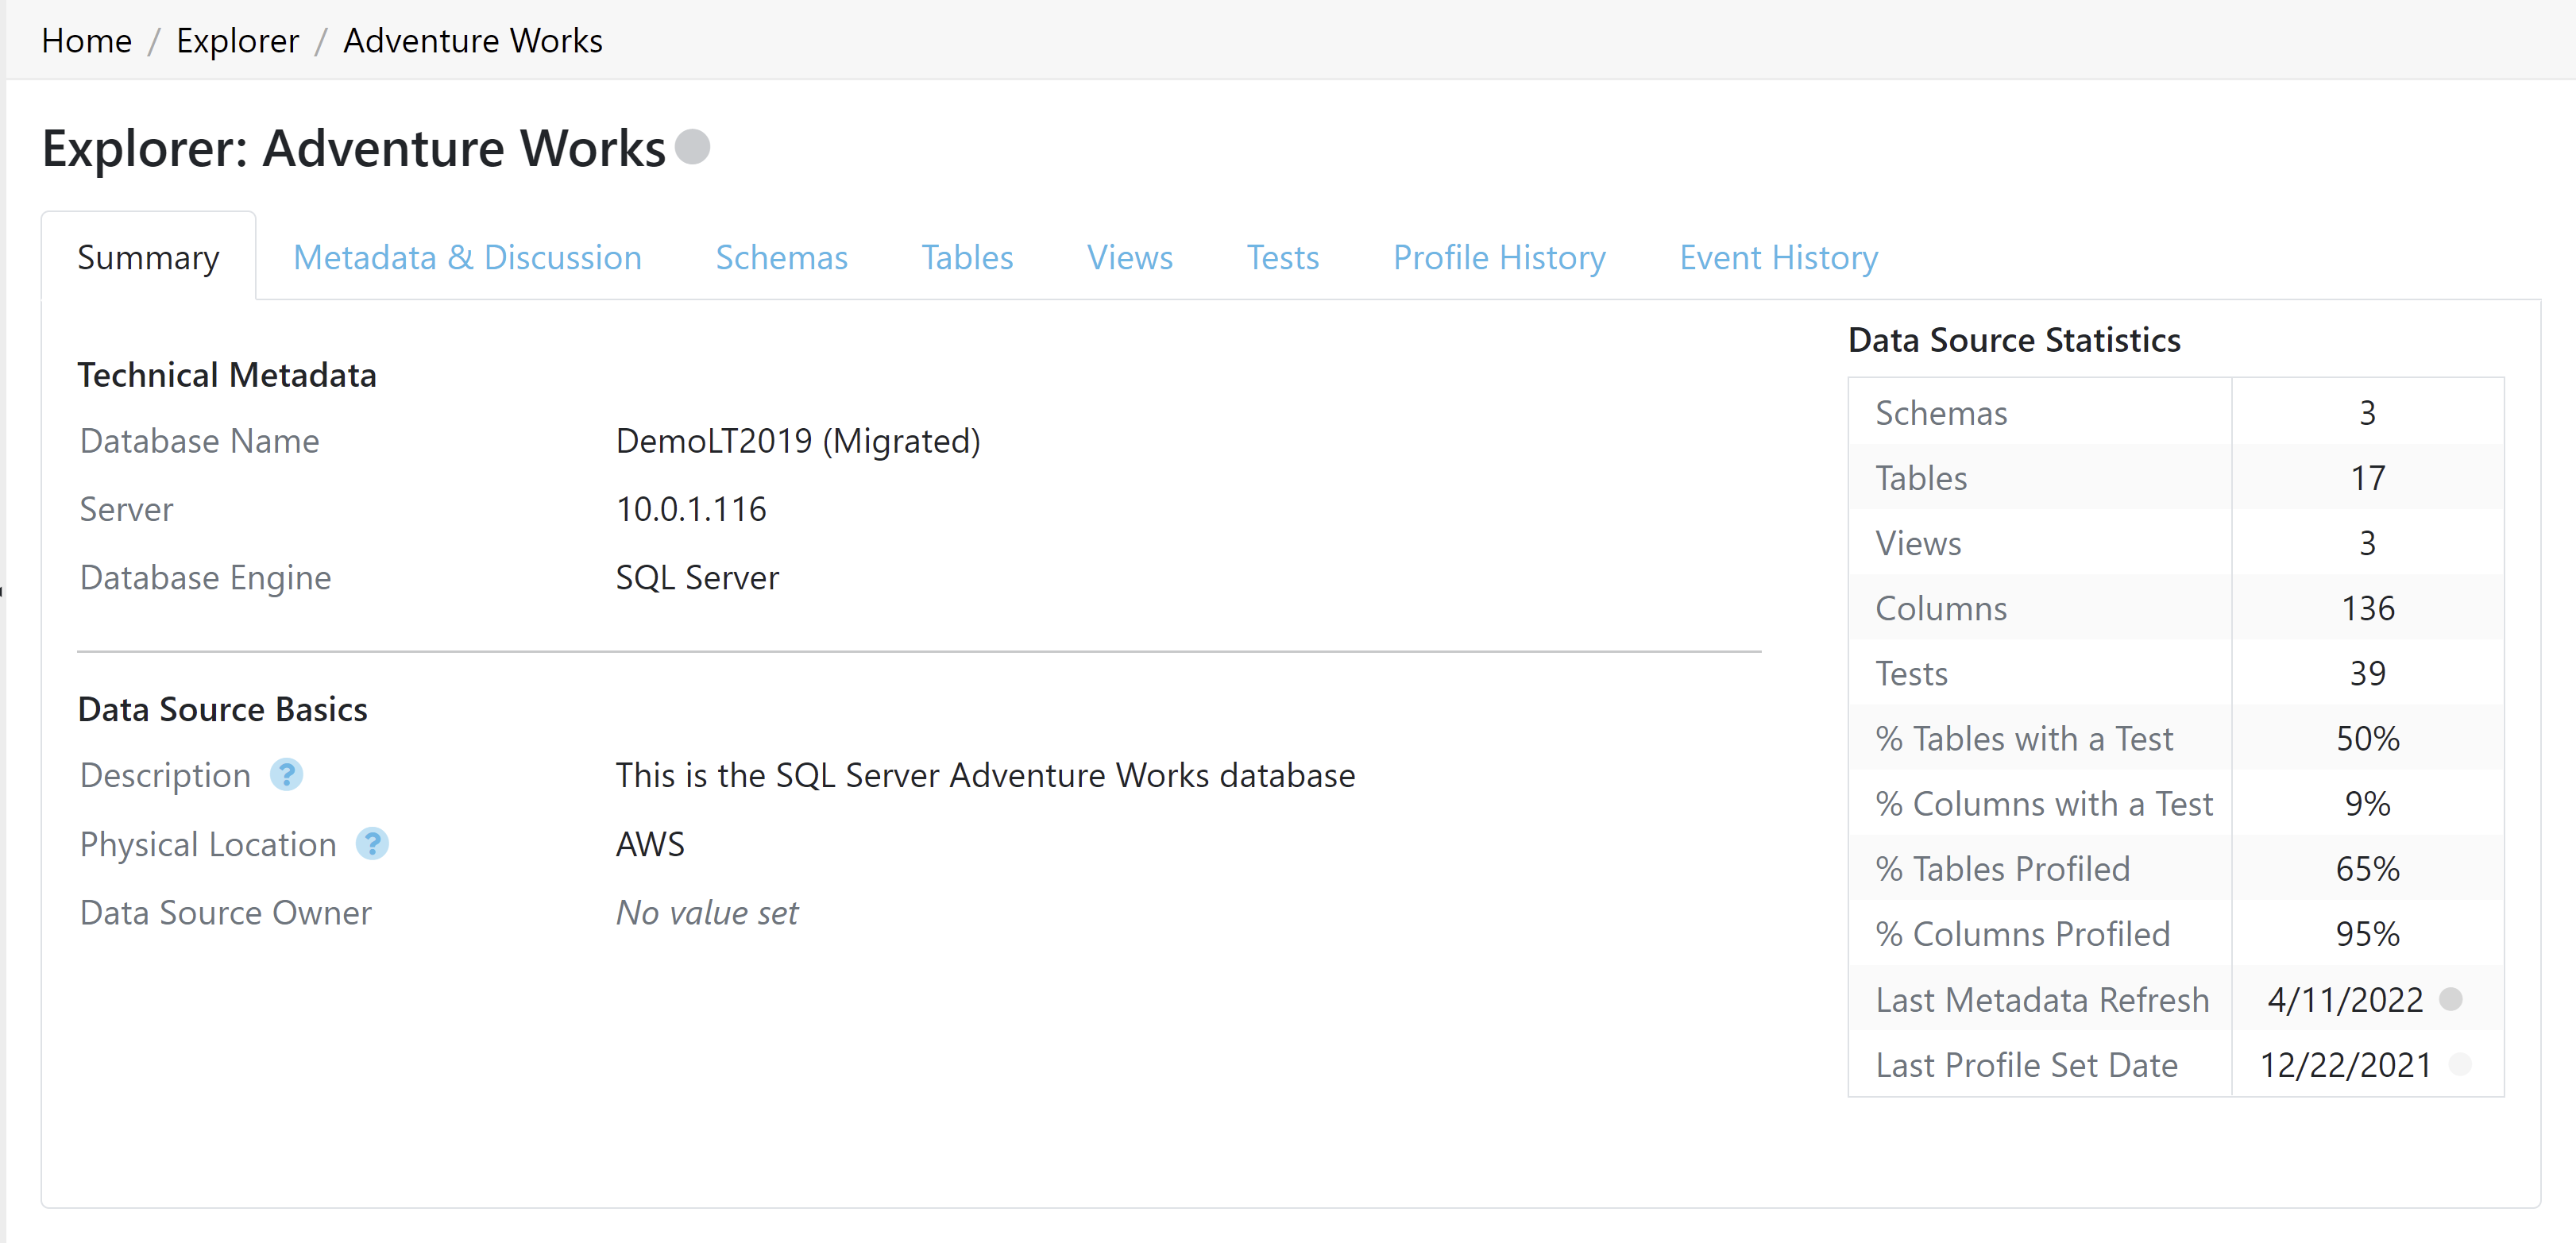
Every metadata object in the Explorer has a Summary tab. The summary tab lists the technical metadata and statistics related to that object as well as the priority custom fields assigned to that object. Keep your metadata refreshed to receive the latest data while viewing the Summary.
Metadata & Discussion
Validatar enables teams to come together to test and discover more about their data. Metadata & Discussion was created for collaboration.
Data Source Metadata
The Metadata section shows all of the custom fields assigned to that object. Custom Field admins can modify custom field values using the Edit button though we recommend making bulk changes by importing custom fields on the Data Source.
Why Add Custom Metadata?
Custom Fields help to centralize information related to your data source. Business analysts tend to keep their work separate from data analysts and testers and then share their findings on an as-needed basis. Custom Fields allow business users to share additional context about a metadata object in the same area where data will be tested. This streamlines information to the tester and allows them to enhance their testing using automation. Automation can be driven by business requirements as well as technical requirements with the use of custom fields.
Comments
In addition, creating a discussion thread directly on the metadata object increases collaboration between the team without having to switch communication platforms. Share data issues, changed processes, and other information quickly with your team members. Simply, begin typing in the comment box to add to the discussion. Don't forget to mention (@) your team member so they can also be notified!
Metadata Object Tabs
Depending on the type of metadata object you're viewing, you will see different tabs appear after Metadata & Discussion. The viewable tabs will be the next associated child object type. For example, when viewing a schema, the shown tabs will be Tables and Views. When viewing a table, the shown tab will be Columns, and so forth.
You'll also see a Metadata & Discussion tab contextualized by that specific metadata object. That way, you can keep a separate discussion going for each object.
Schemas
The Schema tab shows all schema-related custom fields, technical metadata, and schema statistics. Learn about the number of tables and views inside of the schema and how much of the schema is covered by testing and profiles.
You'll be able to drill down into the Tables and Views tabs to view a list of schema-related objects along with their summary profiles.
Tables & Views
The Tables and Views tabs all show custom fields related to tables and table-level statistics. You'll find similar stats found on the schema level, but you'll also get record counts and table size (data size) if it's been stored.
Users on the Enterprise tier of Validatar will also be able to see a table lineage tab if lineage data has been collected in Validatar.
Columns
Once you drill down into a column, you can column-level profile statistics like row count, distinct value count, and null count. Your data must be profiled in order to return any of those stats. You'll also see column-level custom field data. In addition, you'll see a new tab called Column Profile which will show you a full visual representation of your column profiles. Try refreshing your metadata and re-running a profile set to see the changes in profile values.
If you've brought in lineage values for that column, you'll find the Lineage tab along the header as well.
Tests
The Tests tab shows a list of all tests that have either a table or column metadata link related to a data source. Clicking on the test name takes you directly to the test’s configuration screen. You can also see where the test is located within Validatar as well as the pass or fail result trend over the last two weeks.
.png)
Profile History
To see changes in profile results over time, you'll use the Profile History tab. If you view the profile history for the entire data source, you'll be shown a list of all profile sets that were executed. Viewing profile history on table and column objects allows you to pick which profile you want to view and its past record. Choose between a chart and table view to consume the information.
Event History
Lastly, Event History keeps a record of the changes made to a metadata object. You can view if the object itself has changed or if someone updated related Validatar information like comments and custom fields.