Overview
Data profiling in Validatar is the automated analysis of your data's characteristics — row counts, null percentages, distinct value counts, statistical distributions, and more. A SQL-based data source template defines the profile definitions that determine what metrics are available for data sources on that platform. These definitions are the foundation: they specify the SQL expressions that calculate each metric, the conditions under which they apply, and how their results are formatted.
This article covers profiling configuration for Database category templates. For Python-based templates, see Profiling Configuration — Python Templates.
The Profiling Tab — SQL Templates
Open a SQL-based template and navigate to the Profiling tab. You'll see a list of all profile definitions configured for this template.
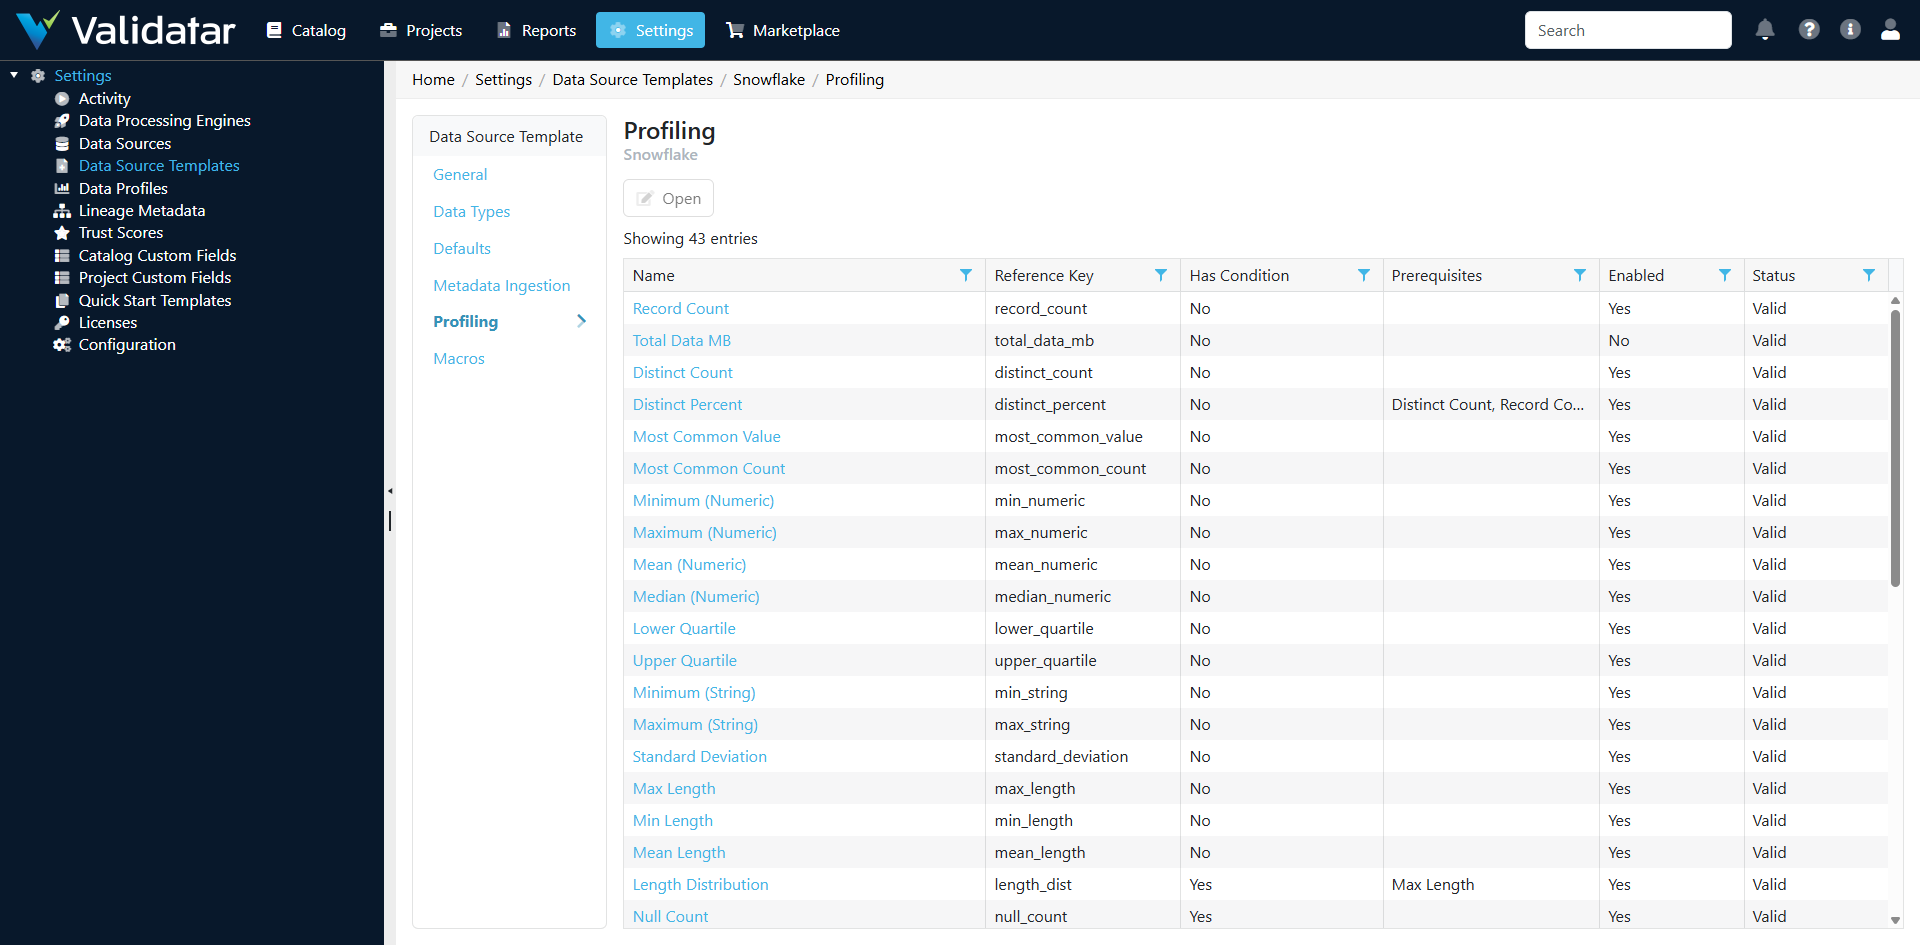
Each profile definition represents one metric that can be calculated against tables or columns in data sources using this template.
Profile Levels
Every profile definition operates at one of two levels:
Table-Level Profiles
Calculate metrics about entire tables. Examples:
| Profile | What It Measures |
|---|---|
record_count |
Total number of rows in the table |
column_count |
Number of columns in the table |
sum_checksum_table |
A checksum across all rows (for change detection) |
total_data_mb |
Total data size in megabytes |
Column-Level Profiles
Calculate metrics about individual columns. Examples:
| Profile | What It Measures |
|---|---|
distinct_count |
Number of unique values |
distinct_percent |
Percentage of values that are unique |
null_count |
Number of null values |
null_percent |
Percentage of null values |
blank_count |
Number of empty string values (string columns only) |
blank_percent |
Percentage of empty strings |
min |
Minimum value |
max |
Maximum value |
mean |
Average value (numeric columns) |
median |
Median value (numeric columns) |
standard_deviation |
Standard deviation (numeric columns) |
most_common_value |
The most frequently occurring value |
most_common_count |
How many times the most common value occurs |
top_ten_values |
The ten most frequent values |
bottom_ten_values |
The ten least frequent values |
distribution_numeric |
Value frequency distribution (numeric columns) |
distribution_string |
Value frequency distribution (string columns) |
year_distribution |
Distribution of values by year (date/datetime columns) |
sample |
Sample values from the column |
Validatar ships with approximately 40 built-in profile definitions covering the most common data quality metrics.
Profile Formats
The format of a profile definition determines how its result is stored and displayed:
Scalar Formats
Return a single value:
| Format | Example Use |
|---|---|
| Numeric Value | record_count → 1,500,000 |
| String Value | most_common_value → "USA" |
| DateTime Value | max on a date column → 2026-04-01 |
| Percent Value | null_percent → 3.45% |
Array Formats
Return a collection of values, typically used for distributions:
| Format | Example Use |
|---|---|
| Numeric Array | distribution_numeric → value bins with counts |
| String Array | top_ten_values → list of values with frequencies |
| DateTime Array | year_distribution → years with record counts |
Array profiles are displayed as charts or tables in the data explorer, giving users visual insight into data distributions.
Profile Formula Types
Each profile definition uses one of three formula types to calculate its result:
Query
The most common type. The profile is calculated by a SQL expression executed against the data source. You configure:
- Aggregate Script — The SELECT clause expression (e.g.,
COUNT(DISTINCT {{column}})) - From Script — The FROM clause (usually the table reference, but can include joins or subqueries)
- Grouping Script — The GROUP BY clause (for array profiles that return grouped results)
Validatar combines these fragments into a complete query. Multiple query-based profiles targeting the same table can be batched into a single query for efficiency.
Example — distinct_count profile:
- Aggregate Script:
COUNT(DISTINCT {{column}}) - From Script:
{{schema}}.{{table}} - Grouping Script: (empty — scalar result)
Example — year_distribution profile:
- Aggregate Script:
YEAR({{column}}) AS grouping_key, COUNT(*) AS value - From Script:
{{schema}}.{{table}} - Grouping Script:
YEAR({{column}})
.NET Calculation
The profile is computed from the results of other profiles using a C# formula expression. This is used for derived metrics that don't require a separate database query.
Example — distinct_percent:
A .NET Calculation that divides distinct_count by record_count and multiplies by 100. It depends on both distinct_count and record_count being calculated first (see Prerequisites below).
Python Calculation
Similar to .NET Calculation, but uses a Python formula expression. Useful for more complex statistical calculations or when the logic is easier to express in Python.
Configuring a Profile Definition
Click on a profile definition in the list to open its detail page.
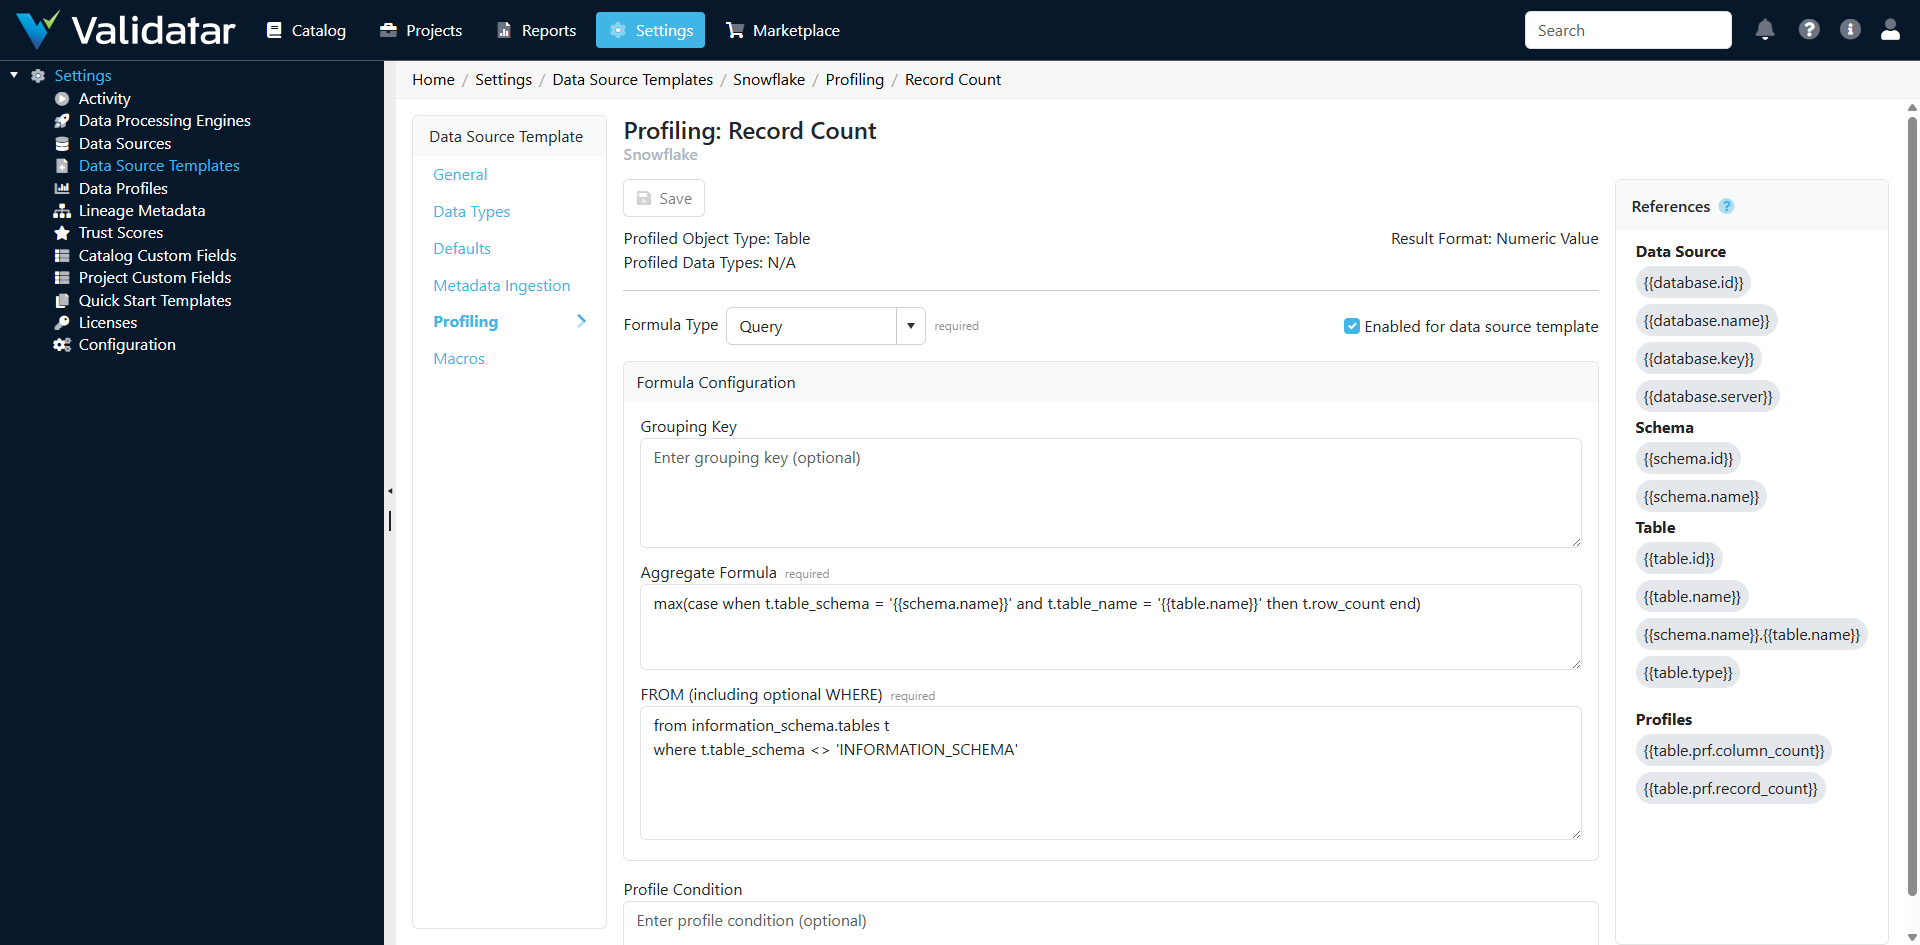
Key Configuration Fields
| Field | Description |
|---|---|
| Name | Display name for the profile (e.g., "Distinct Count") |
| Reference Key | Unique identifier used programmatically (e.g., distinct_count) |
| Level | Table or Column |
| Format | The result format (Numeric, String, DateTime, Percent, or Array variants) |
| Formula Type | Query, .NET Calculation, or Python Calculation |
| Restrict to Data Types | When enabled, the profile only applies to columns of specific data types |
Condition Expressions
A condition expression determines whether a profile should run for a given table or column. This is a boolean expression evaluated before execution.
Common uses:
- Only profile numeric columns: restrict based on data type
- Only profile tables above a certain row count: require
record_count > 0 - Skip profiling for columns with too many distinct values:
distinct_count < 1000000
Condition expressions can reference the results of other profiles (which must be listed as prerequisites).
Prerequisites
Some profiles depend on the results of other profiles. For example:
distinct_percentneedsdistinct_countandrecord_countto be calculated first- A condition expression that checks
record_count > 0needsrecord_countas a prerequisite - A
.NET Calculationprofile references the results of its prerequisite profiles
Prerequisites ensure profiles execute in the correct order and that dependent values are available.
How Template Profiles Flow to Data Sources
Templates define what profiles are available. The actual decision of which profiles to run, on which objects, and when happens at the data source level through profile sets.
The relationship:
- Template defines profile definitions (the metrics catalog)
- Data source has one or more profile sets (see Profile Sets)
- Each profile set selects which profile definitions to include
- Profile sets also define:
- Which tables and columns to profile (via object filters)
- Execution settings (max concurrent queries, max profiles per query)
- Schedule (how often to run)
- Retention (how long to keep historical results)
When a profile set executes, it runs the selected profile definitions against the selected objects, using the SQL expressions defined on the template.
Tip: If you add a new profile definition to a template, it becomes available for selection in profile sets on all data sources using that template — but it won't automatically run. Someone needs to add it to the relevant profile sets.
Best Practices
- Start with the built-in profiles — The default set covers most common use cases. Add custom profiles only when you need platform-specific or domain-specific metrics.
- Use condition expressions wisely — They prevent unnecessary profiling (e.g., don't compute
meanon string columns) and can improve performance by skipping profiles on very large tables. - Define prerequisites correctly — Missing prerequisites can cause profiles to fail or produce incorrect results. If a profile references another profile's result, list it as a prerequisite.
- Test SQL expressions on the target platform — Profile SQL runs directly against your database. Verify that functions like
PERCENTILE_CONT,STDDEV, or platform-specific functions are available on your database version. - Consider performance — Array profiles (distributions, top-N lists) can be expensive on large tables. Use condition expressions to skip them for tables above a certain size, or configure profile sets with appropriate concurrency limits.
How This Fits Into the Bigger Picture
Profile definitions on the template determine the data quality metrics available across all data sources on the platform. They feed into profile sets (configured per data source), which produce the profiling results visible in the data explorer and used by trust scores. Profiles also serve as data sources for tests — profile results can be used as test data sets, enabling tests that compare current profile values against historical baselines or expected thresholds.
For more on how profile sets work at the data source level, see Profile Sets. For the complete template overview, see Data Source Templates: The Complete Picture.